 English
  العربية
  日本語
日本語  한국어
한국어  Tiếng Việt
  ไทย
ไทย  Bahasa Melayu
  فارسی
فارسی  Bahasa Indonesia
  ဗမာစာ
ဗမာစာ  简体中文
简体中文  香港中文
香港中文  繁體中文
繁體中文  Русский
  Deutsch
  Nederlands
  Italiano
  Français
  Español
  Português
  Afrikaans
  Azərbaycan dili
  Български
  ਪੰਜਾਬੀ
  हिन्दी
  اردو
اردو  বাংলা
বাংলা  Հայերեն
  Íslenska
  Қазақ тілі
  नेपाली
  Српски језик
  Kiswahili
  తెలుగు
  Basa Jawa
  தமிழ்
தமிழ்  मराठी
मराठी 95% vs 90% Round-Trip Efficiency in Home Energy Storage
Residential energy storage / field note
10 kWh · daily cycle
Five points do not disappear.
When a home battery cycles every day, the distance between a 95% and 90% round trip becomes a visible operating cost.
A distributor is comparing two 10 kWh home storage systems for a European retrofit program. System A lists 95% round-trip efficiency. System B lists 90%. Both use LFP cells, both pair with a 5 kW hybrid inverter, and both fit the same wall-mount enclosure. The five-point difference looks small on a sales sheet. It is not small when the battery cycles every day for ten years.
The confusion starts with the word efficiency. Some suppliers quote battery DC efficiency, some quote inverter efficiency, and others quote a best-case round-trip figure measured at a specific load, temperature and state of charge. These numbers do not describe the same boundary.
This article shows what the 95% and 90% figures mean in a complete residential system, how much energy the difference represents, and which design and procurement questions prevent an attractive datasheet number from becoming a field performance problem.
01 / Measurement boundary
The Five Percentage Points That Disappear in the Power Path
Round-trip efficiency measures the energy you can recover after charging and discharging the system. If the system absorbs 10 kWh from the AC side during charging and later returns 9.5 kWh to the AC side, its round-trip efficiency is 95%.
The calculation is simple:
ENERGY DELIVERED DURING DISCHARGE ÷ ENERGY ABSORBED
DURING CHARGE
For a complete AC-coupled or DC-coupled home system, losses come from several physical components. A 51.2 V LFP pack usually contains sixteen 3.2 V nominal cells in series. The cells and busbars create resistive loss. The BMS consumes a small amount of power. MOSFETs, fuses, contactors and cables add more. The hybrid inverter then converts AC to DC while charging and DC back to AC while discharging.
A complete system loss boundary
At 25°C and around 0.5C, a well-built 10.24 kWh LFP battery may achieve 97–99% DC battery efficiency under a controlled test. That does not mean the complete installation achieves 97–99%. A hybrid inverter might reach 96–98% in its efficient operating range, while standby consumption, MPPT conversion and low-load switching reduce the result at the system boundary.
Consider two typical paths for a 10 kWh nominal battery:
| Energy path | 95% system | 90% system |
|---|---|---|
| Energy absorbed during charging | 10.00 kWh | 10.00 kWh |
| Energy returned after one round trip | 9.50 kWh | 9.00 kWh |
| Energy lost per round trip | 0.50 kWh | 1.00 kWh |
| Extra loss versus 95% system | — | 0.50 kWh |
Scroll horizontally on small screens
The 90% system loses twice as much energy per cycle in this example. A five-percentage-point reduction from 95% to 90% represents a 10% reduction in recovered energy relative to the 95% baseline, not merely a cosmetic change to the headline number.
The test conditions matter just as much as the percentage. Ask whether the supplier measured DC-to-DC or AC-to-AC performance, whether the figure includes standby consumption, and whether the battery used its full usable window. A claim measured at 0.5C and 25°C cannot represent the same field result as a claim measured at 0.1C with the inverter disconnected from the calculation.
02 / Operating value
How Efficiency Changes Daily Energy Yield and Payback
Assume a household sends 10 kWh into the battery each day and uses the stored energy later that evening. At 95% round-trip efficiency, the home receives about 9.5 kWh back. At 90%, it receives about 9 kWh. The lower-efficiency system loses an additional 0.5 kWh every day.
Additional daily loss
0.5
kWh not delivered each day at 90% instead of 95%
Difference over 10 years
1,825
kWh before seasonal cycling, capacity fade and idle periods
Over a year of daily cycling, that difference becomes approximately 182.5 kWh. Over ten years, it becomes 1,825 kWh before accounting for seasonal cycling, capacity fade and periods when the battery remains idle. At an electricity value of €0.30 per kWh, the extra energy cost is about €547.50 over ten years. At €0.15 per kWh, it is about €273.75.
This calculation does not automatically make the 95% product the better purchase. The higher-efficiency system may cost more, use a larger inverter, or require a different cooling design. The correct comparison uses total delivered energy, not only purchase price.
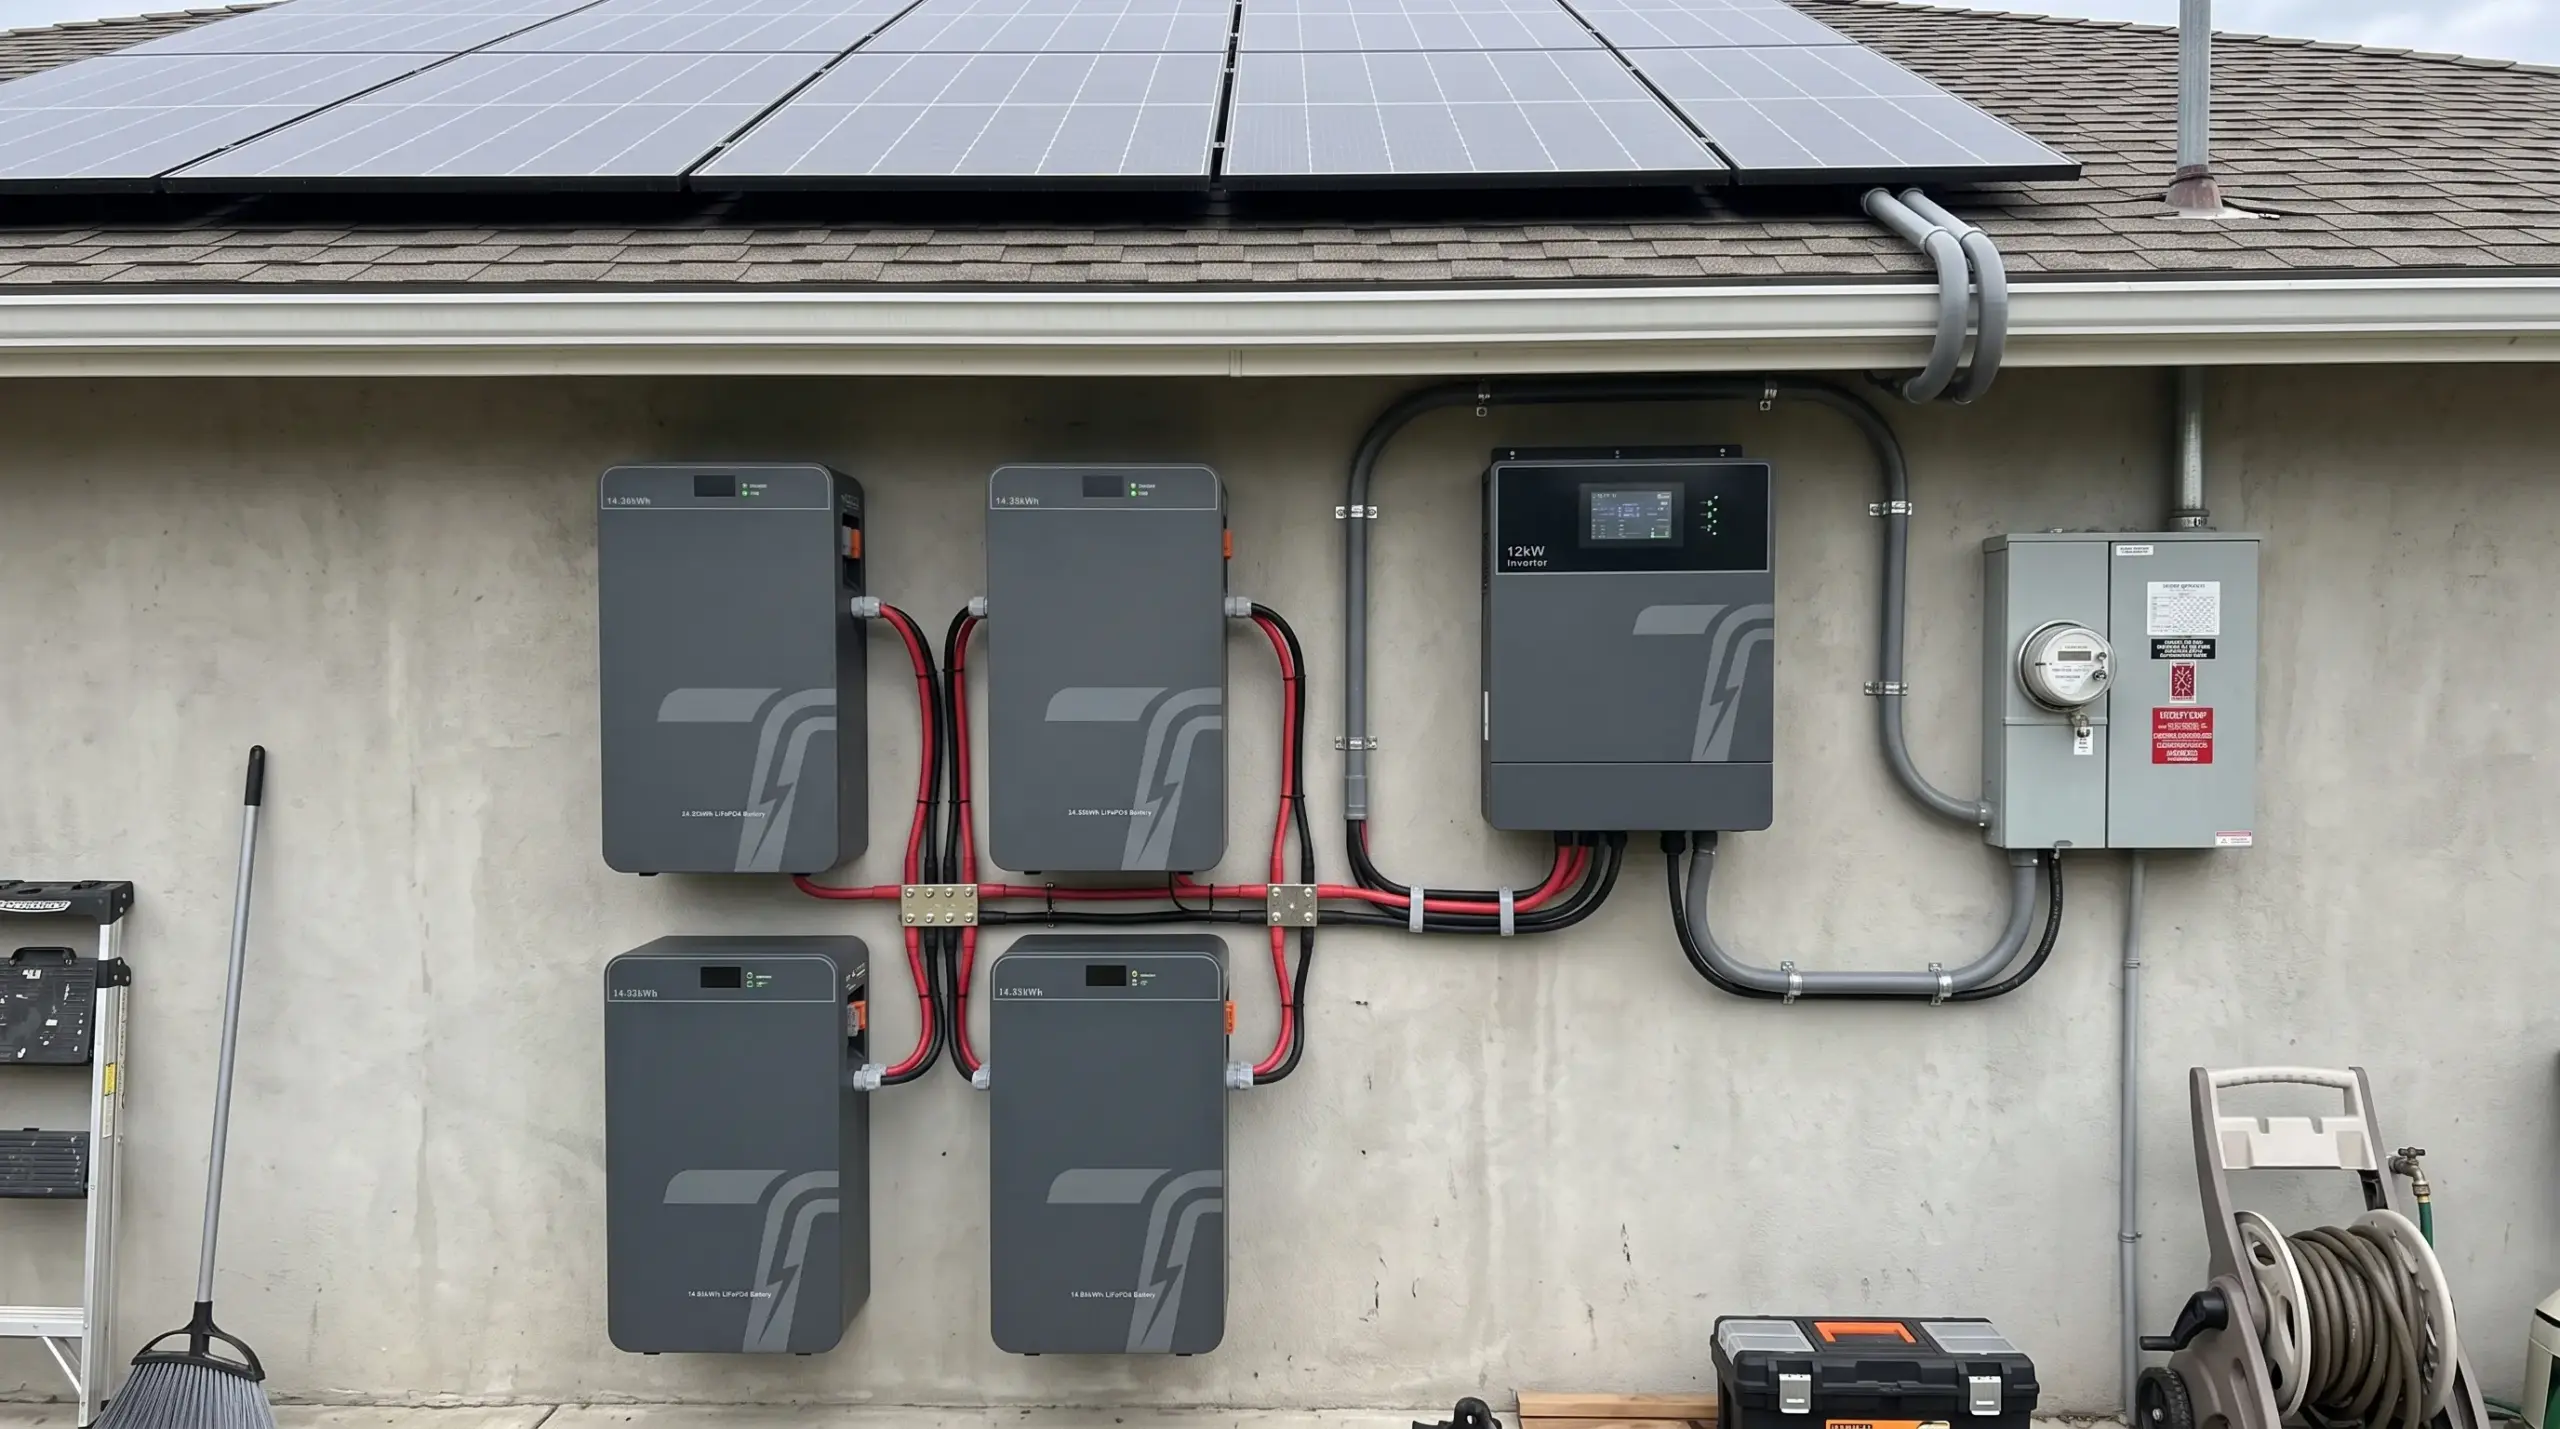
Insert project image / system installation
For a 5 kW inverter, a 10 kWh LFP pack running at 0.5C delivers a practical full-power discharge. At that load, cell resistance and inverter switching losses become visible. If the same system spends most of its time at 300 W overnight, fixed inverter consumption can dominate the loss percentage. A system that tests at 95% near 0.5C may perform below 90% during long periods of very low load unless the inverter enters an efficient sleep mode.
Temperature creates another gap. LFP charging below 0°C requires a BMS restriction or a battery heater, depending on the product design. At 45°C ambient, the BMS may reduce charge or discharge current to protect the cells. The electrical loss also rises as cell resistance increases. For installers in northern Europe, a heated indoor enclosure and a 5–35°C operating target can protect the stated efficiency. For hot regions, airflow, heat paths and an enclosure rated for the installation environment matter more than a laboratory peak.
03 / Factory control
What the OEM or ODM Can Tune Before Production
Efficiency is partly a cell specification and partly a system integration decision. A genuine OEM or ODM partner should be able to show where the loss occurs and which parameters the factory can tune for your product line.
Architecture
Short, correctly sized conductive paths protect delivered energy at high current.
Communication
CAN or RS485 data lets the inverter respond to real pack limits.
Firmware
Sleep thresholds and charge behaviour affect real low-load efficiency.
Validation
A test matrix reveals more than a single rounded efficiency number.
The first lever is the electrical architecture. A 51.2 V, 200 Ah LFP pack uses approximately 10.24 kWh nominal capacity. Correct busbar sizing, short cable runs, low-resistance contactors and properly torqued terminals reduce DC loss. For a 5 kW load, the pack current approaches 98 A at nominal voltage. A loose terminal or undersized cable can create heat and measurable voltage drop at that current.
The second lever is BMS and inverter communication. CAN or RS485 communication lets the battery report SOC, temperature, allowable charge current and allowable discharge current. The inverter can then avoid pushing a cold or hot pack at a fixed current. A BMS that only sends a rough SOC value may cause unnecessary top-balancing, conservative cutoffs or repeated current limiting, all of which reduce usable energy.
The third lever is firmware. An ODM factory can set sleep thresholds, charge termination behavior, SOC calibration and current limits for your inverter brand. It can also provide connector variants, pinout documentation, branded labels, multilingual displays and a white-label enclosure. Request sample units with production-intent firmware, not engineering firmware that hides standby behavior.

Insert factory validation image
The fourth lever is validation. Ask for an AC-to-AC test report at 0.25C, 0.5C and 1C, plus results at 10°C, 25°C and 40°C. Request the usable SOC window, discharge power, inverter model, idle power and capacity-retention condition. A factory that can return a test matrix and sample lead time in weeks is easier to qualify than one that provides a single rounded percentage.
04 / Buying decision
90% vs 95% Efficiency Decision Matrix
The following comparison uses a 10.24 kWh 51.2 V LFP system, daily cycling and a 5 kW hybrid inverter. Values are planning figures, not a substitute for a product-specific test report.
| Specification | 95% round trip | 90% round trip | Procurement meaning |
|---|---|---|---|
| Energy returned from 10 kWh input | 9.5 kWh | 9.0 kWh | 0.5 kWh extra daily loss at 90% |
| Approximate annual loss | 182.5 kWh | 365 kWh | Based on one full equivalent cycle per day |
| Ten-year extra loss at 90% | — | 1,825 kWh | Excludes degradation and idle periods |
| Typical DC battery efficiency | 97–99% | 94–97% | Verify test boundary and C-rate |
| Likely system use case | Daily solar shifting | Backup or lower-cycle use | Match efficiency to operating profile |
| Priority during sourcing | Thermal and firmware validation | Price and standby control | A low purchase price may hide operating cost |
Scroll horizontally on small screens
For a battery that cycles only during occasional outages, the 90% system may be commercially sensible. It loses fewer kilowatt-hours because it rarely moves energy. For a battery that shifts solar energy every day under a time-of-use tariff, 95% normally earns its premium more quickly.
Do not compare efficiency without checking the usable SOC window. A product that claims 95% at 90% usable DOD may deliver less daily energy than a 90% product with a larger pack or a wider validated operating window. Divide the purchase price by expected lifetime AC-delivered kilowatt-hours to make the comparison fair.
05 / Field checklist
Four Common Efficiency Mistakes in Home Storage Projects
One – Comparing DC efficiency with AC efficiency. A battery supplier may quote 98% DC-to-DC efficiency while an inverter supplier quotes 97% peak conversion efficiency. Multiplying those figures does not produce a complete annual round-trip result because standby power and operating conditions remain outside the calculation. Define the measurement boundary first.
Two – Treating peak efficiency as average efficiency. Inverter efficiency often peaks around 30–60% of rated power. A 5 kW unit running continuously at 200 W may consume a much larger percentage of the transferred energy than the same unit running at 3 kW. Request an efficiency curve and an idle-power figure.
Three – Ignoring temperature and current. A 10 kWh LFP pack at 25°C and 0.5C does not behave like the same pack at 40°C and 1C. Check thermal derating, charge limits below 0°C, and whether the enclosure uses passive cooling, forced airflow or an integrated heater.
Four – Allowing installation losses to erase the specification. Long DC cables, loose terminals, poor crimping and incorrect CAN termination can reduce delivered energy and trigger false alarms. For a 51.2 V pack delivering nearly 100 A, follow the cable gauge, fuse rating, connector pinout and terminal torque specified by the manufacturer.
06 / Buyer FAQ
Questions Buyers Ask About Conversion Efficiency
Is 95% round-trip efficiency worth paying more for?
Does 95% mean the battery itself is 95% efficient?
What efficiency should I expect from a 48 V LFP home battery?
Can an OEM improve the efficiency after I choose the cells?
Final specification
Specify the Energy You Actually Need Delivered
The difference between 95% and 90% is one extra half-kilowatt-hour lost for every 10 kWh round trip. That number becomes material in a daily-cycling residential fleet, but it should not be judged separately from usable capacity, inverter standby power, temperature derating, warranty conditions and total delivered lifetime energy.
When you qualify a home storage supplier, ask for an AC-to-AC test report rather than accepting a peak battery efficiency figure. Give the factory your system voltage, inverter model, daily load curve, target DOD, installation temperature range and expected cycle count. We’ll return a preliminary BOM, efficiency test plan and warranty assumptions within 24 hours.
Related guide / battery chemistry
LFP or NMC for Home Energy Storage – Which Chemistry Belongs on Your Wall
Related guide / warranty
What Is Depth of Discharge and Why It Decides Your Battery Warranty
Related guide / system sizing
5kWh, 10kWh or 15kWh – How to Choose the Right Residential Energy Storage Capacity