 English
  العربية
  日本語
日本語  한국어
한국어  Tiếng Việt
  ไทย
ไทย  Bahasa Melayu
  فارسی
فارسی  Bahasa Indonesia
  ဗမာစာ
ဗမာစာ  简体中文
简体中文  香港中文
香港中文  繁體中文
繁體中文  Русский
  Deutsch
  Nederlands
  Italiano
  Français
  Español
  Português
  Afrikaans
  Azərbaycan dili
  Български
  ਪੰਜਾਬੀ
  हिन्दी
  اردو
اردو  বাংলা
বাংলা  Հայերեն
  Íslenska
  Қазақ тілі
  नेपाली
  Српски језик
  Kiswahili
  తెలుగు
  Basa Jawa
  தமிழ்
தமிழ்  मराठी
मराठी How High Is the Failure Rate of an Energy Storage System?
A field guide to service events, availability, component risk, and the OEM decisions that shape an energy storage system’s real-world performance.
What the Failure Rate Actually Measures
When a distributor or installer asks about the failure rate of an energy storage system, they usually want one number. In practice, no single percentage applies to every system. A 10 kWh wall-mounted LFP battery, a 1 MWh container, and a commercial system with several inverters have different failure patterns and different ways to count an incident.
A useful answer is that a well-designed battery system should deliver high availability, but it will still produce occasional service events. For planning purposes, many operators use an annual system-level failure estimate of roughly 1% to 3% for mature, properly installed equipment. That is a planning range, not a universal industry guarantee. The contract, operating environment, commissioning quality, and definition of “failure” can move the result considerably. When assessing backup performance, it also helps to understand what happens to connected loads when a grid-tied energy storage system loses grid power.
First separate a battery fault from a system outage. A battery management system (BMS) may record a warning without stopping operation. An inverter communication fault may interrupt output for ten minutes and then clear after a restart. A failed contactor or damaged power module requires a physical repair. Treating all three events as the same failure makes the data difficult to use.
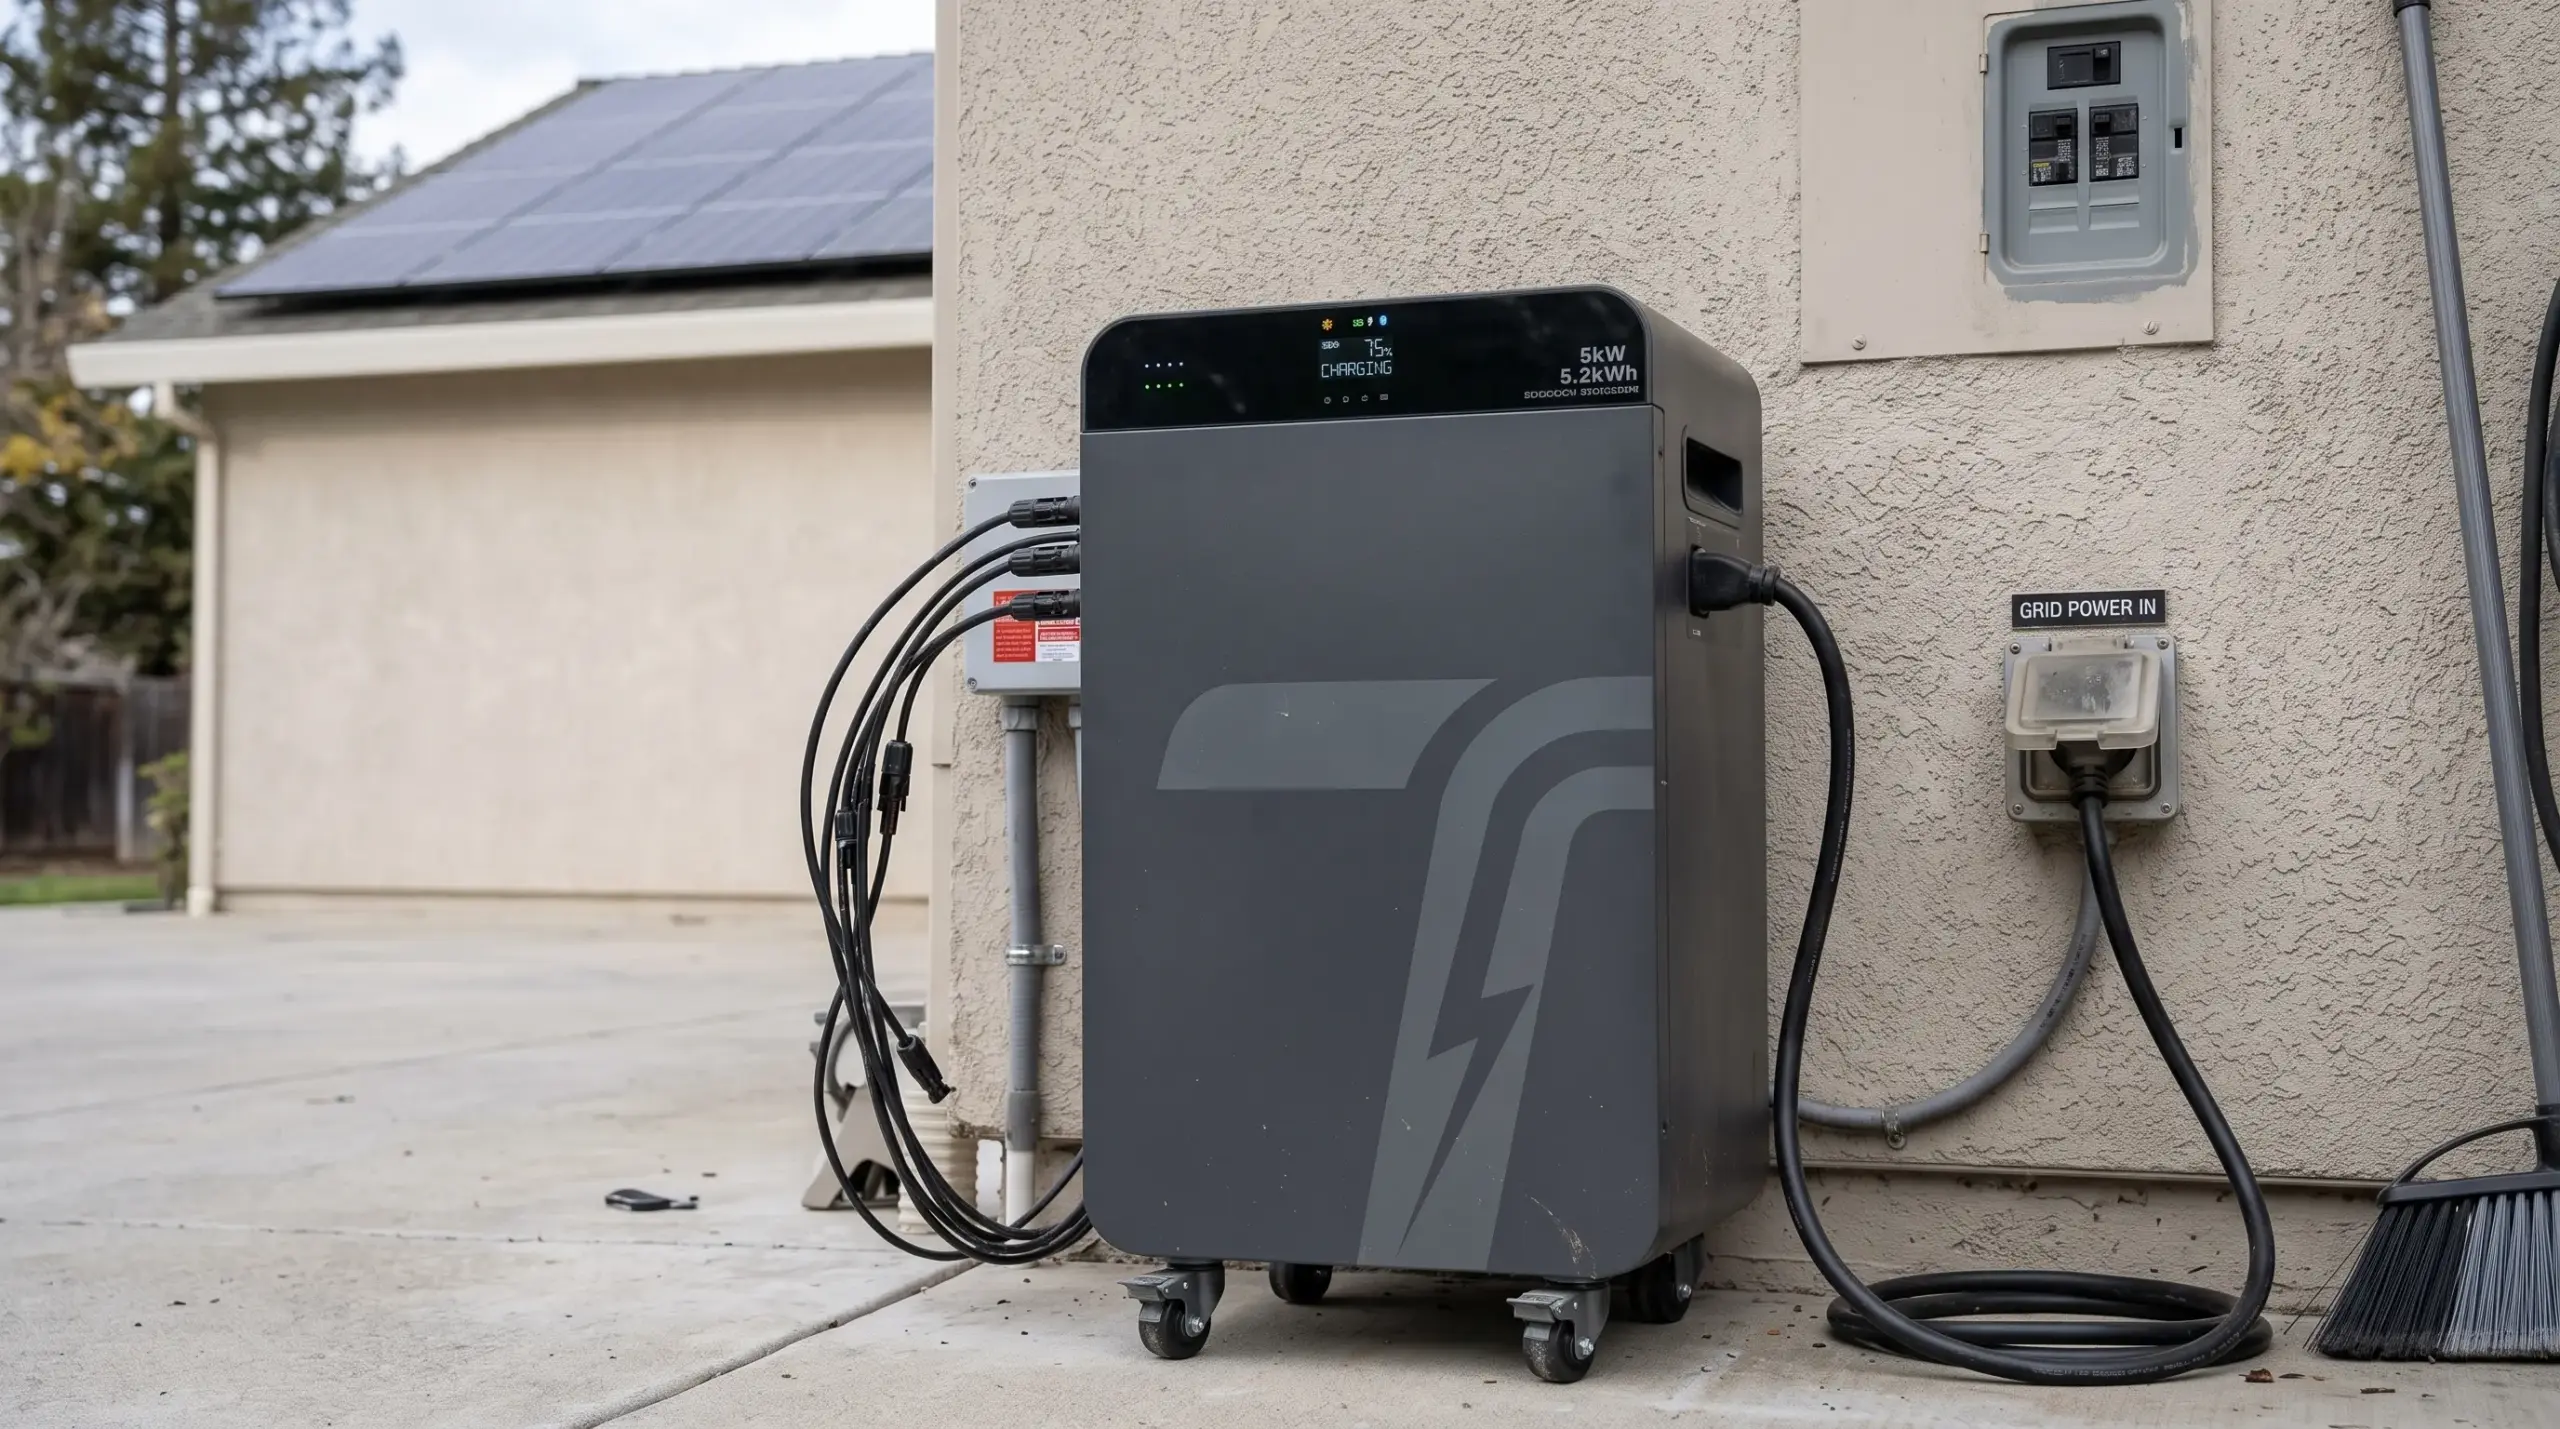
For a typical 51.2 V LFP battery pack, the BMS monitors 16 cells, pack current, and temperature. A normal operating window may be 44.8 to 57.6 V, with charge and discharge limits adjusted by temperature. At 25°C and a moderate 0.5C rate, the battery may reach 5,000 to 6,000 rated cycles, but cycle life does not eliminate electronic or connection-related faults. In a larger system, the inverter, contactors, cooling fans, fuses, sensors, and communication harness can create more service events than the cells themselves. These monitoring and protection functions are part of the BMS-equipped 51.2 V home energy storage systems used in residential installations.
The more practical metric is availability. If a system operates for 8,760 hours in a year and loses 9 hours to service, its technical availability is about 99.9%, even though it experienced a reportable event. Ask suppliers for both figures: the number of failures per operating year and the time required to restore service.
Which Parts Usually Cause Service Events
Battery cells are often blamed first, but they are not always the most common source of downtime. Poor crimping, loose terminals, incorrect firmware settings, and inverter-BMS communication errors can appear earlier in the field.
| Subsystem | Typical field symptom | Main control point |
|---|---|---|
| LFP cell and module | Cell-voltage imbalance, reduced usable capacity | Cell matching, balancing strategy, charge limits |
| BMS and sensors | Alarm, shutdown, inaccurate state of charge | Firmware validation, sensor placement, CAN or RS485 mapping |
| Inverter and power electronics | No output, derating, restart loop | Heat dissipation, firmware, DC protection, load profile |
| Contactors, fuses, and terminals | Intermittent connection or complete isolation | Correct torque, insulation clearance, inspection schedule |
| HVAC or cooling fan in a cabinet | High-temperature alarm, power derating | Airflow, filter cleaning, ambient temperature control |
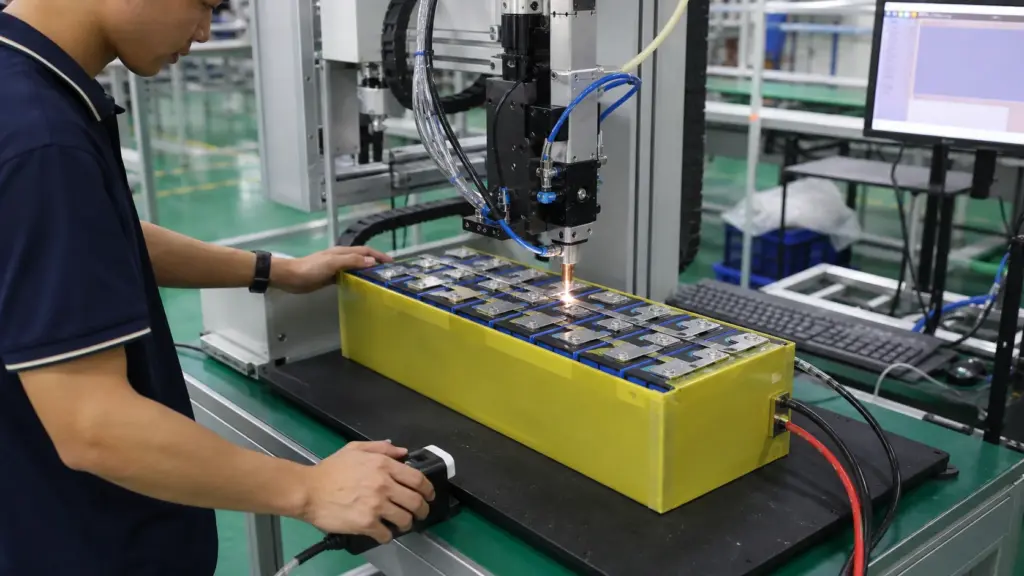
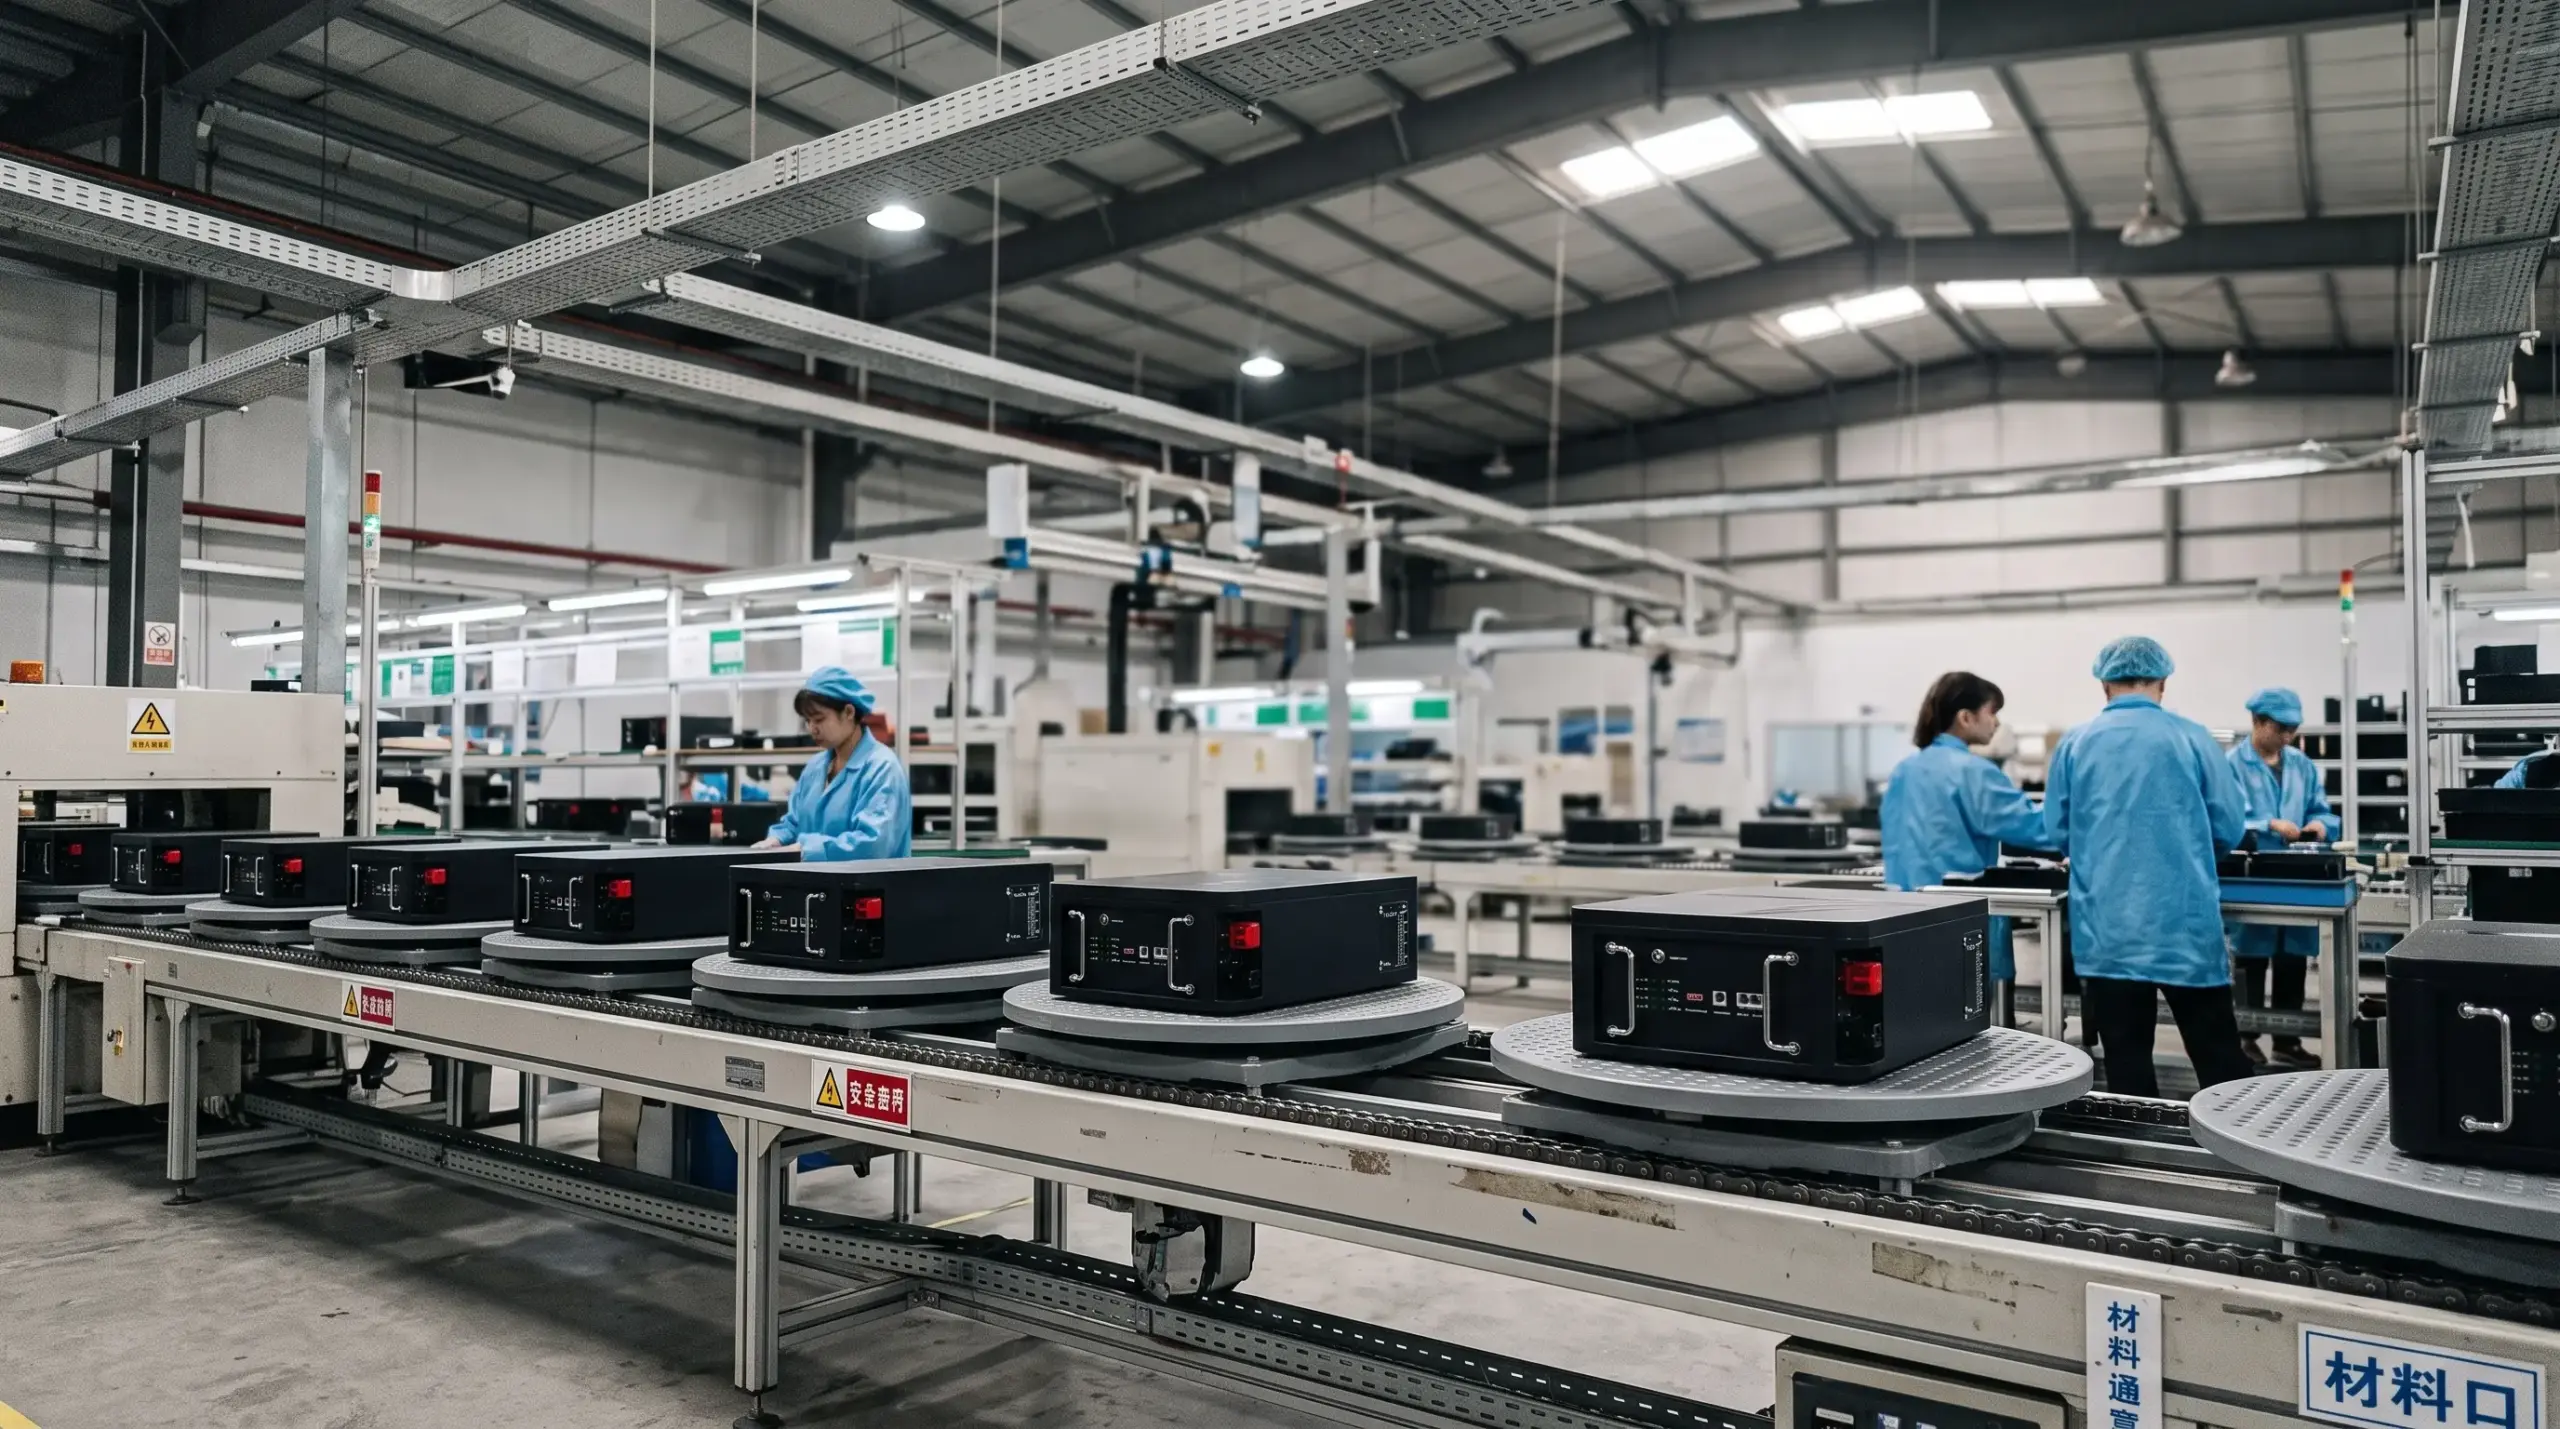
Temperature has a direct effect on risk. Operating an LFP battery continuously above 45°C accelerates ageing and can force the BMS to derate charge current. At low temperatures, charging below 0°C without suitable protection can damage the cells. Installers should also leave ventilation space around the inverter and keep the enclosure within its specified range, often around -20°C to 50°C for the battery electronics, depending on the model. Incoming, in-process, final, and outgoing checks help catch quality issues before equipment reaches the field; TURSAN describes these stages in its battery quality control process.
Why System Size Changes the Numbers
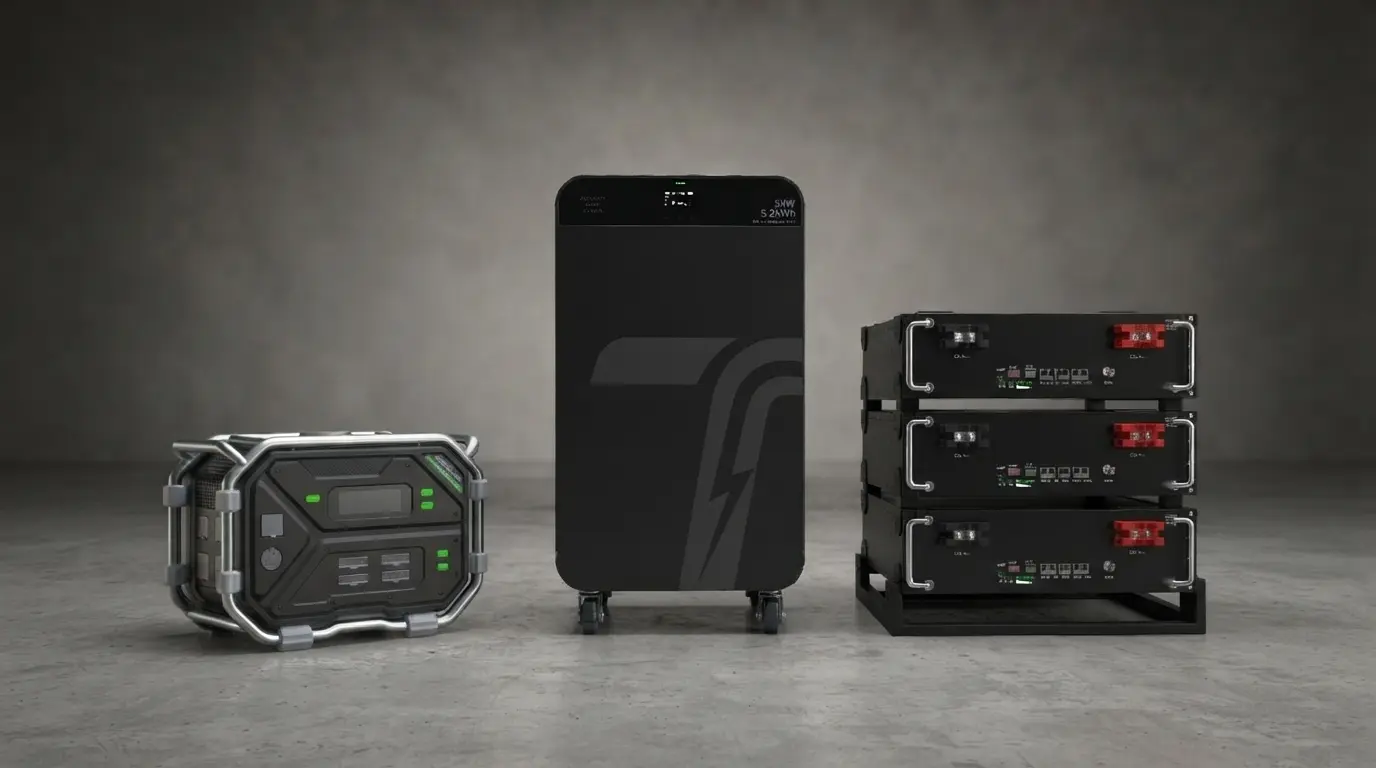
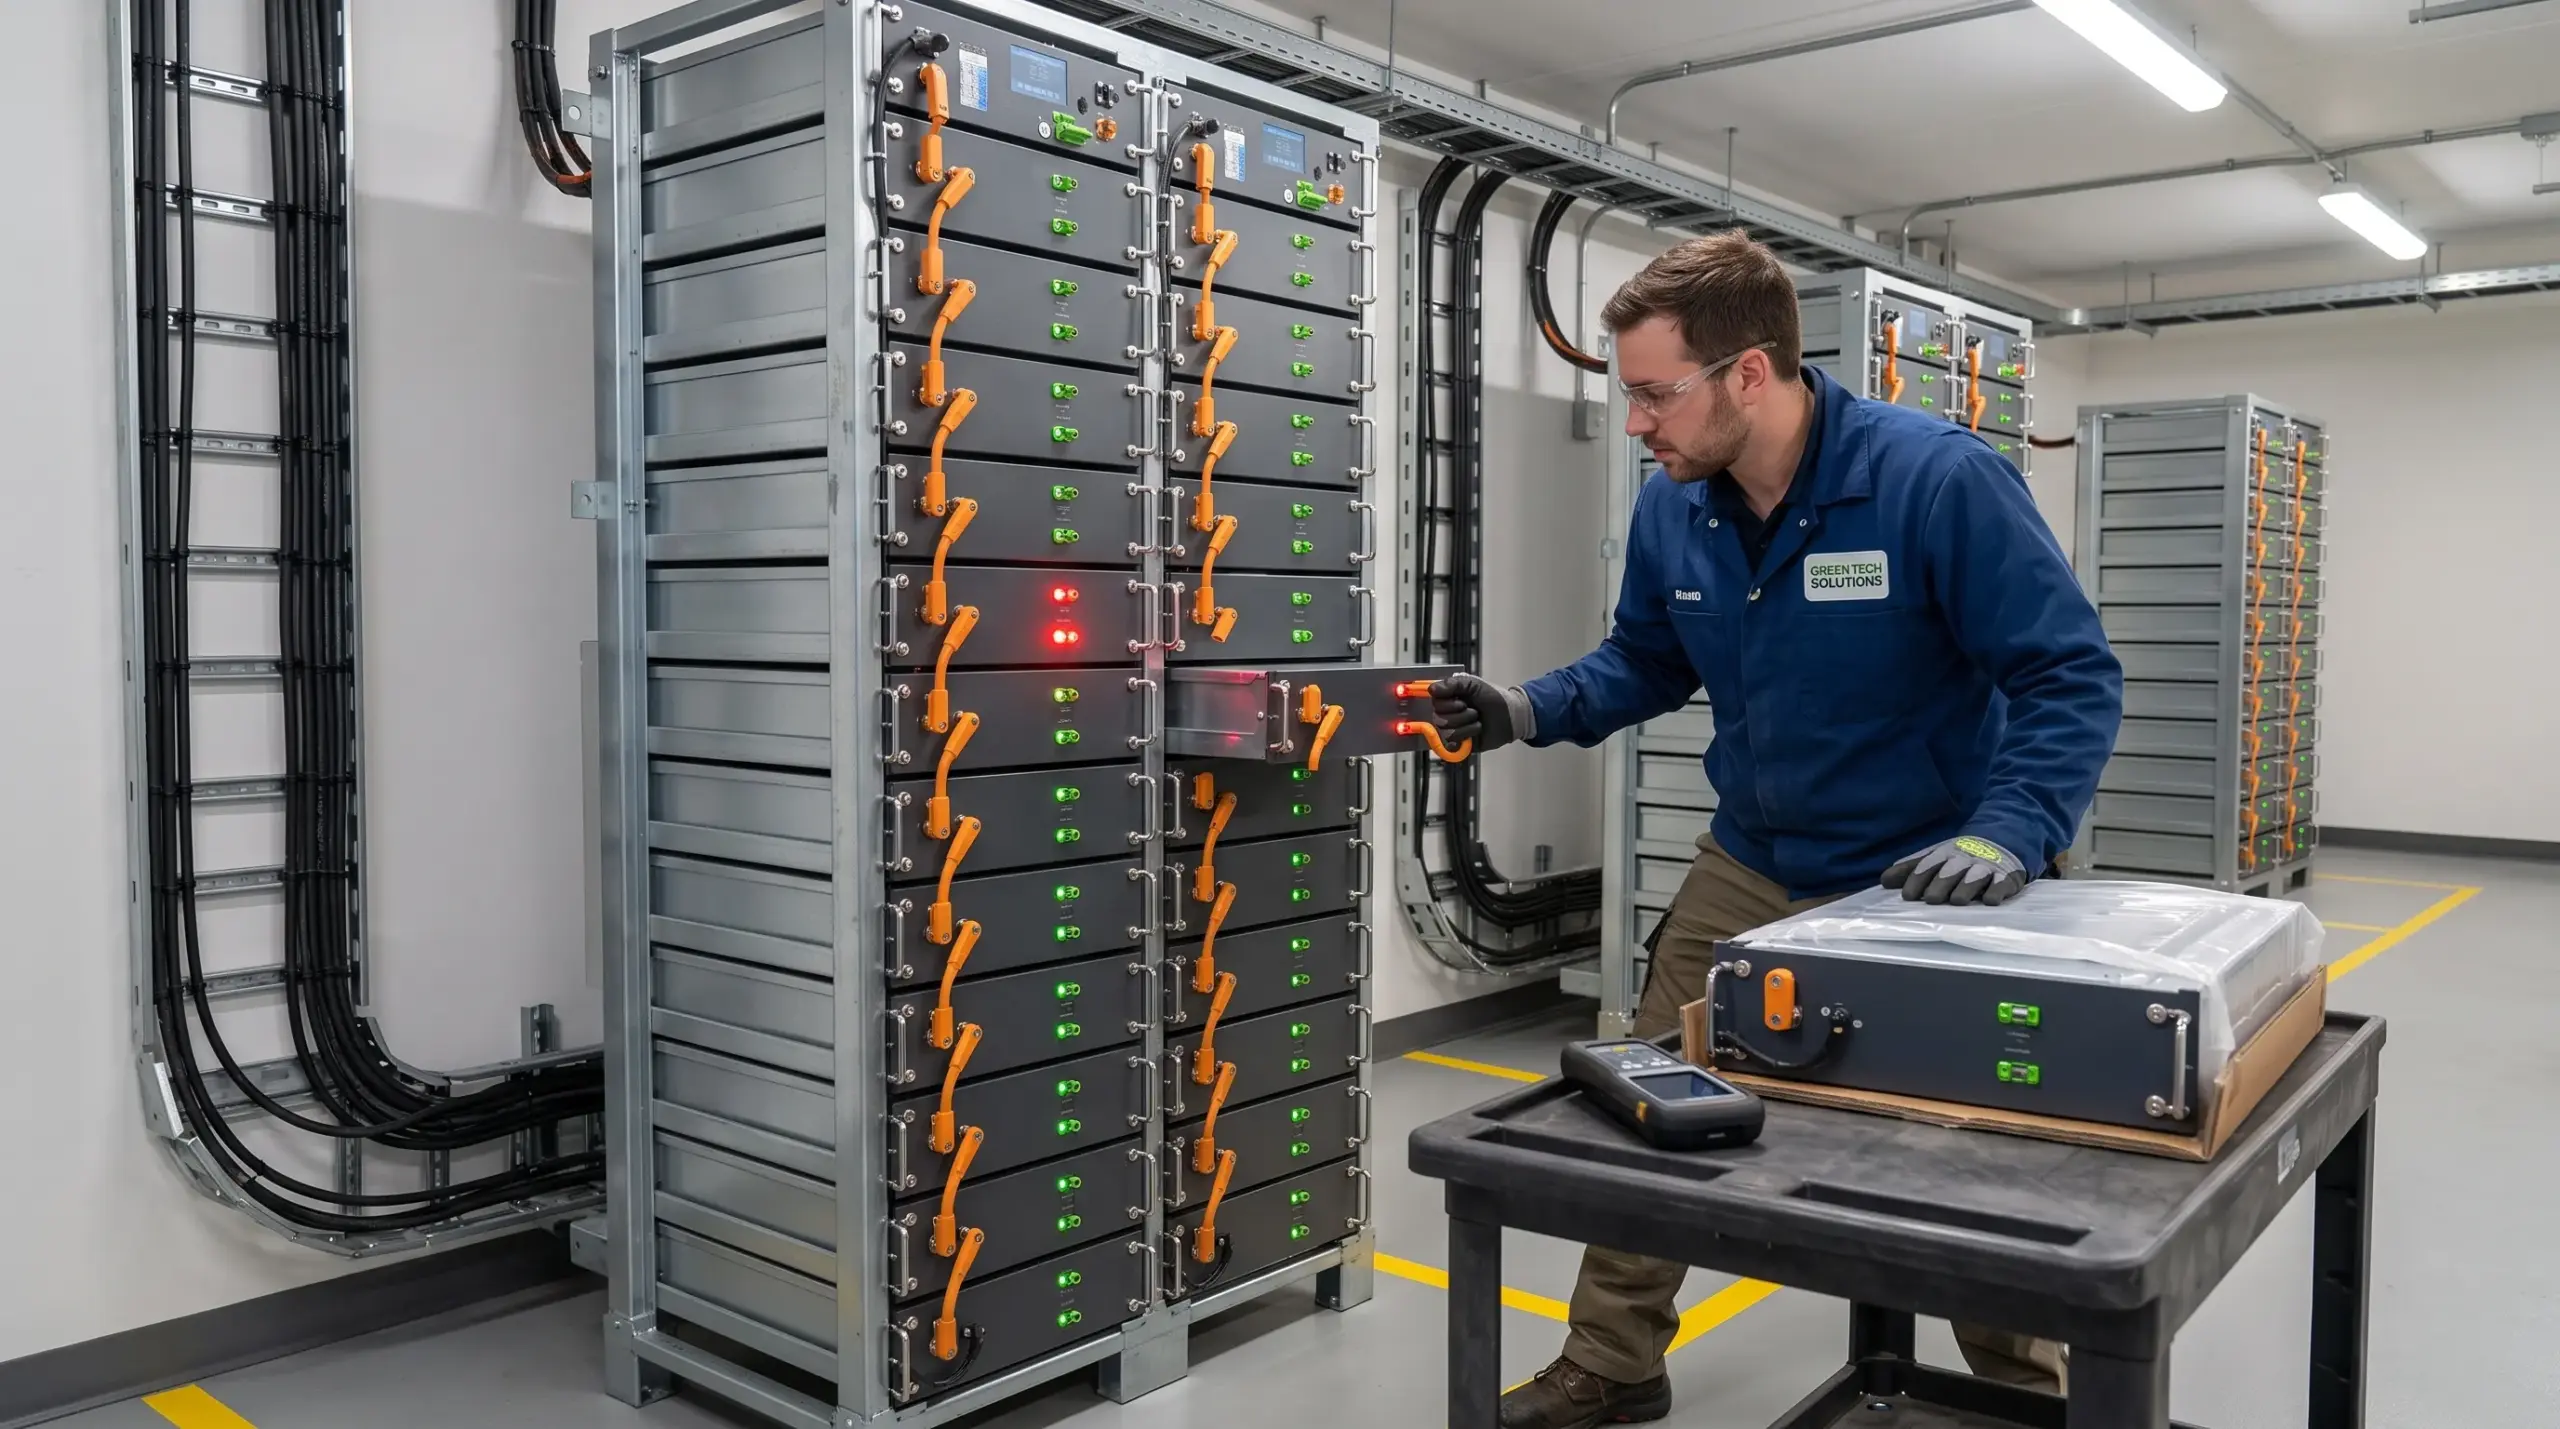
More components create more potential points of failure. A small residential battery may have one BMS, one contactor set, and one inverter. A containerized system can include multiple battery racks, bidirectional inverters, liquid or forced-air cooling, smoke detection, fire suppression, and an energy management controller. For smaller modular deployments, a 5.22 kWh rack-mount ESS integrates cells, BMS, and enclosure in a compact 19-inch format.
This does not mean a large system is automatically unreliable. It means the operator needs a better maintenance plan and a clear definition of partial failure. If one rack is offline while the remaining racks continue to operate, the site has reduced capacity rather than a total outage. Procurement teams should request rack-level monitoring, event logs, replaceable modules, and a documented mean time to repair.
The OEM and ODM Variables That Matter
An OEM or ODM partner can reduce avoidable service events before production starts. The important questions are specific. Does the BMS firmware support the selected inverter over the required CAN or RS485 protocol? Has the supplier tested the actual cell batch at the requested discharge rate? Can the label, connector position, enclosure, and alarm logic match the installer’s existing equipment? Reviewing a supplier’s OEM and ODM customization process can help clarify which design and integration checks are available before a production order.
Ask for a pilot sample, a communication test report, and a defined failure-return process before placing a large order. Firmware tuning may take one to three weeks after the inverter model is confirmed, while a pilot battery often needs several weeks for assembly and verification. Confirm the warranty separately for cells, BMS boards, inverter power modules, and labor. A low purchase price does not help if a distributor must replace a complete cabinet for a failed fan or sensor.
Four Common Causes of Unexpected Failures
- Incorrect commissioning – Installers skip polarity checks, set the wrong battery voltage range, or connect an inverter with an unverified protocol. Require a commissioning checklist and record the initial BMS data.
- Loose or overheated connections – A terminal that misses its specified torque can develop resistance and heat under load. Use the manufacturer’s torque value, often around 5 to 8 Nm for battery terminals, and inspect high-current joints during scheduled service.
- Heat and restricted airflow – A cabinet placed in direct sun or against a blocked wall can derate long before the cells reach their expected cycle life. Measure the actual enclosure temperature, not just the outdoor temperature.
- Unclear alarm handling – Operators repeatedly reset a BMS alarm without checking the event code. This can turn a recoverable sensor or communication issue into a longer outage. Keep the alarm table, wiring diagram, and firmware version with the system.
FAQ
It can be a reasonable planning assumption for a mature system, but the definition matters. Ask whether 1% means one complete system outage, one component replacement, or one service ticket per operating year. Also ask for the repair time and the percentage of events resolved remotely.
Not automatically. High daily throughput, high C-rates, elevated temperature, and deep discharge accelerate ageing. A system operating at 0.5C with controlled temperature may age more predictably than one exposed to repeated 1C peaks, even if both use the same LFP chemistry.
Request the tested operating temperature range, cell and module test records, BMS communication list, alarm log format, component-level warranty, spare-parts list, and expected response time. For larger projects, request availability calculations based on the actual system architecture rather than a generic brochure figure.
The Practical Answer
The failure rate of an energy storage system is usually low enough for commercial operation, but it is never a meaningful number without scope. For a properly matched LFP system, a 1% to 3% annual service-event range can support early planning. Use availability, repair time, component-level data, and operating conditions to make the final decision.
Send your system voltage, daily load curve, target ambient temperature, and inverter model to an OEM or ODM supplier. A competent engineering team can then return a preliminary BOM, communication plan, spare-parts recommendation, and maintenance estimate based on your actual installation rather than an average failure-rate claim. TURSAN’s OEM/ODM team can use these project details to discuss system customization and integration requirements.